Relational Data Browsing
Navigate bidirectionally through the database by following foreign key based or user defined relationships

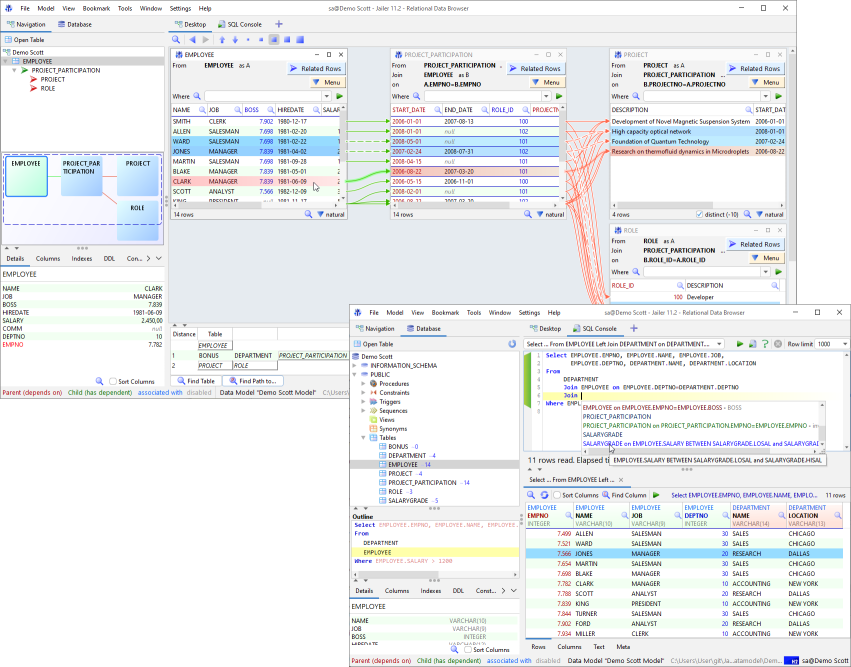
The Data Browser
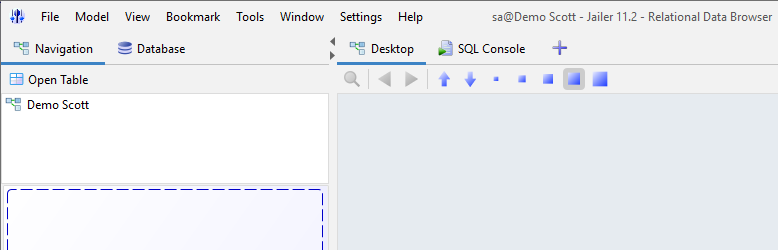
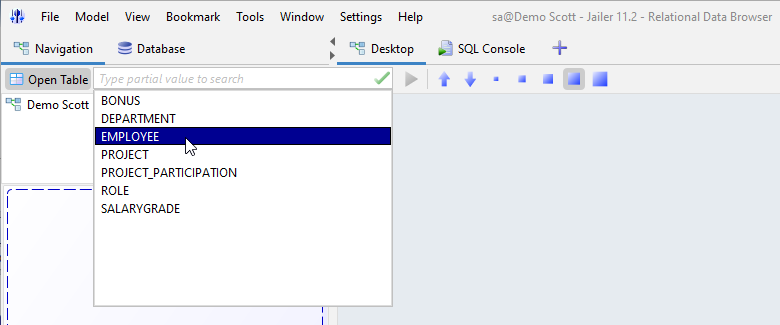
All begins with the first table
Open Table "EMPLOYEE".
Our first table with the data of all employees appears.
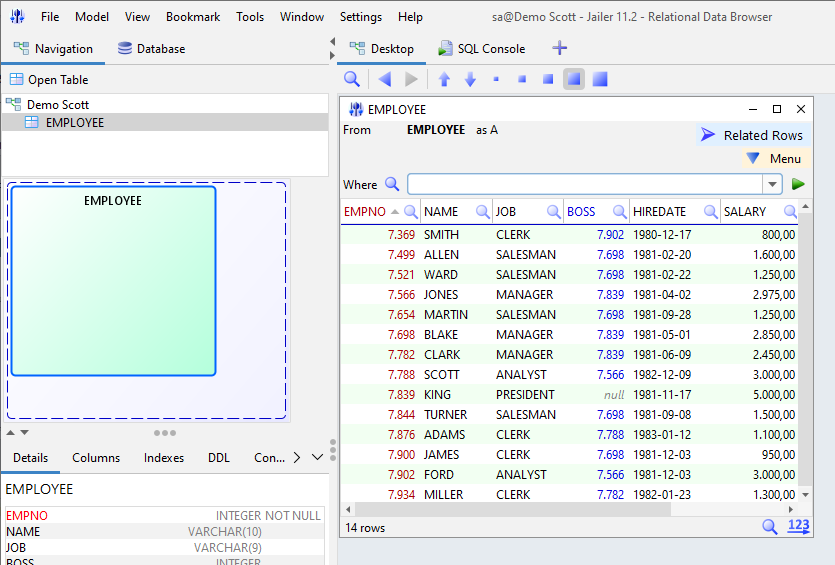
Where do they all work?
Under "Related Rows" we find the "DEPARTMENT" table.
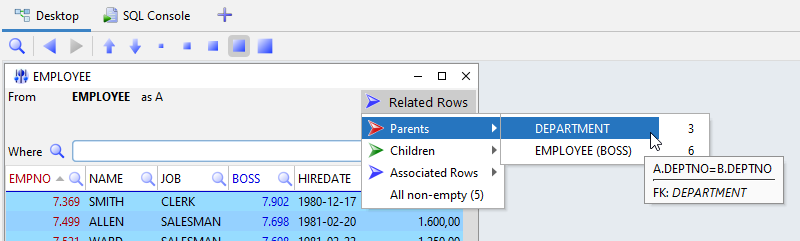
The "DEPARTMENT" table appears and shows not only all departments, but also which employee belongs to which department.
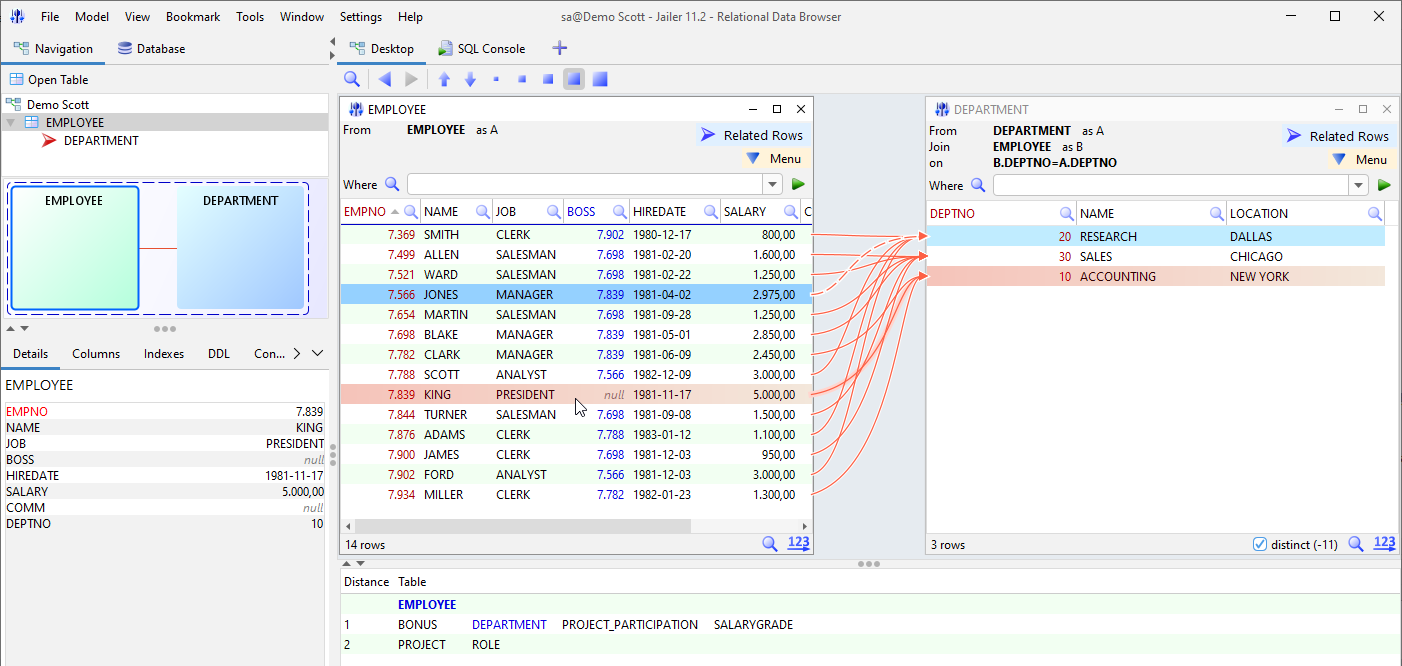
And what are they actually working on?
In the "Closure" view we can see with which tables the selected table is related. Moreover, also the relations of these and so on.
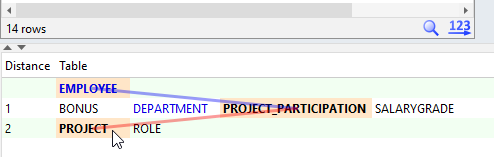
With a double click on "PROJECT" the table "PROJECT_PARTICIPATION" opens and with it connected "PROJECT".
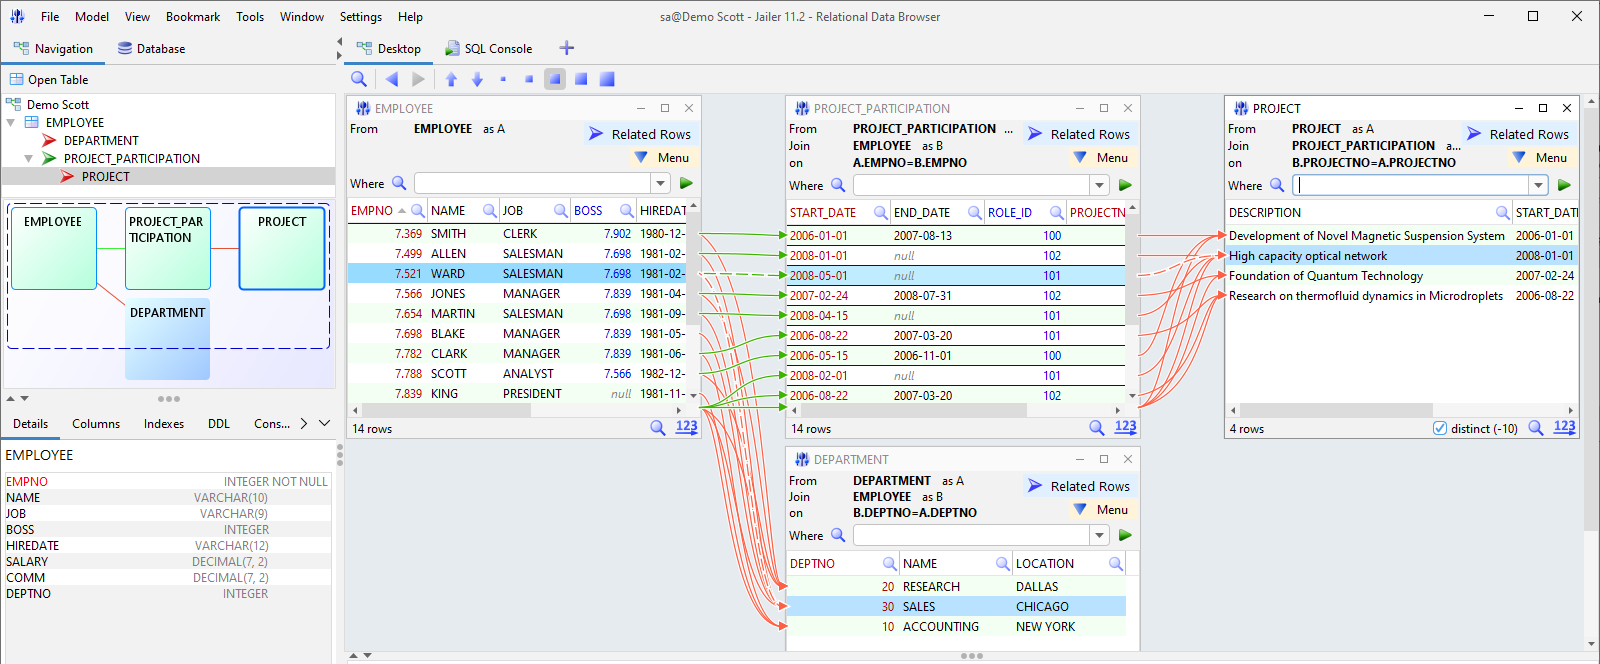
We can minimize the "PROJECT_PARTIPITATION" table...
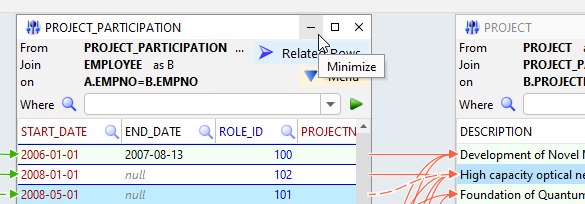
...to see the relationship between employees and projects directly.
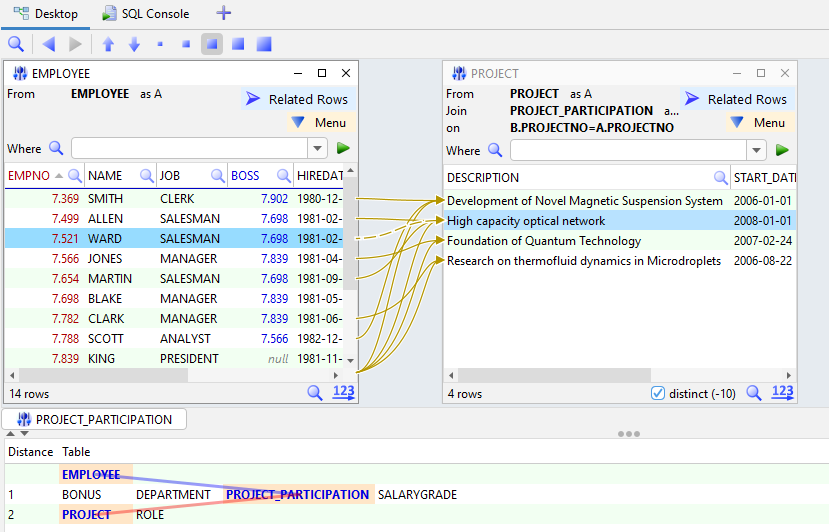
The way to the SQL console
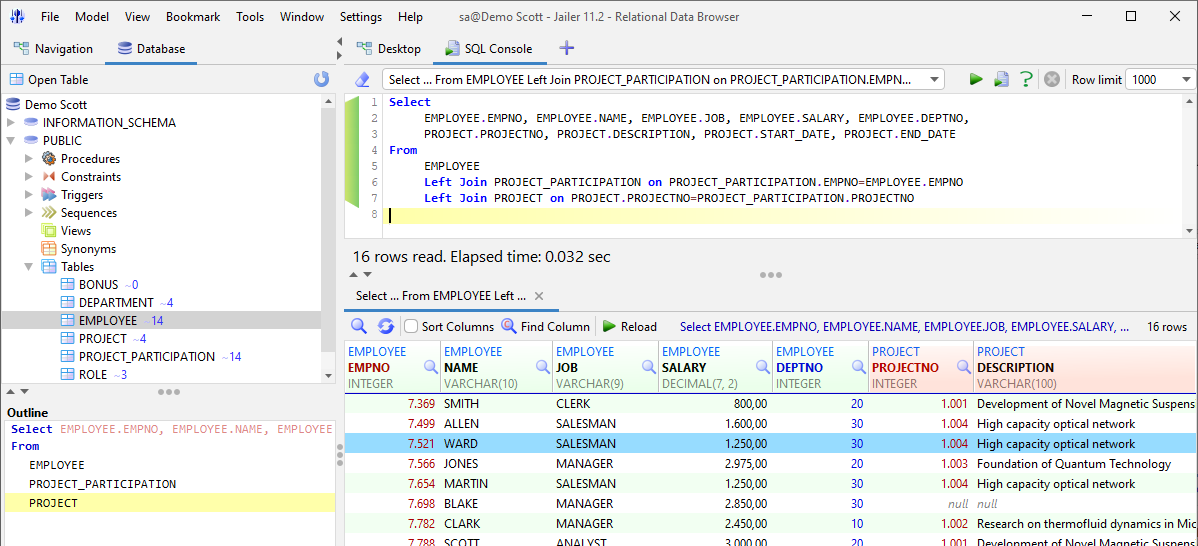
From the network of interconnected tables on the desktop, we can automatically create an SQL query that will retrieve exactly the same data that can be seen here.
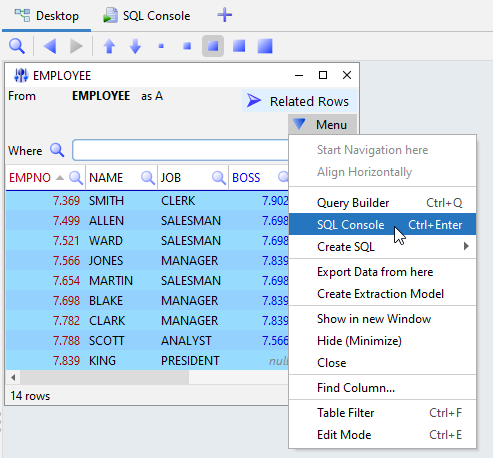
Use the menu item "Query Builder (Ctrl+Q)" to make some adjustments to this query first.
Use "SQL Console (Ctrl+Enter)" to go directly to the SQL console.
Using the console, we can then make whatever queries we want, view the results, and do all the things we usually do with such tools.
SQL Console - Chart
The SQL Console includes a Chart tab that turns query results into interactive
charts - directly in the result view, without any extra tools.
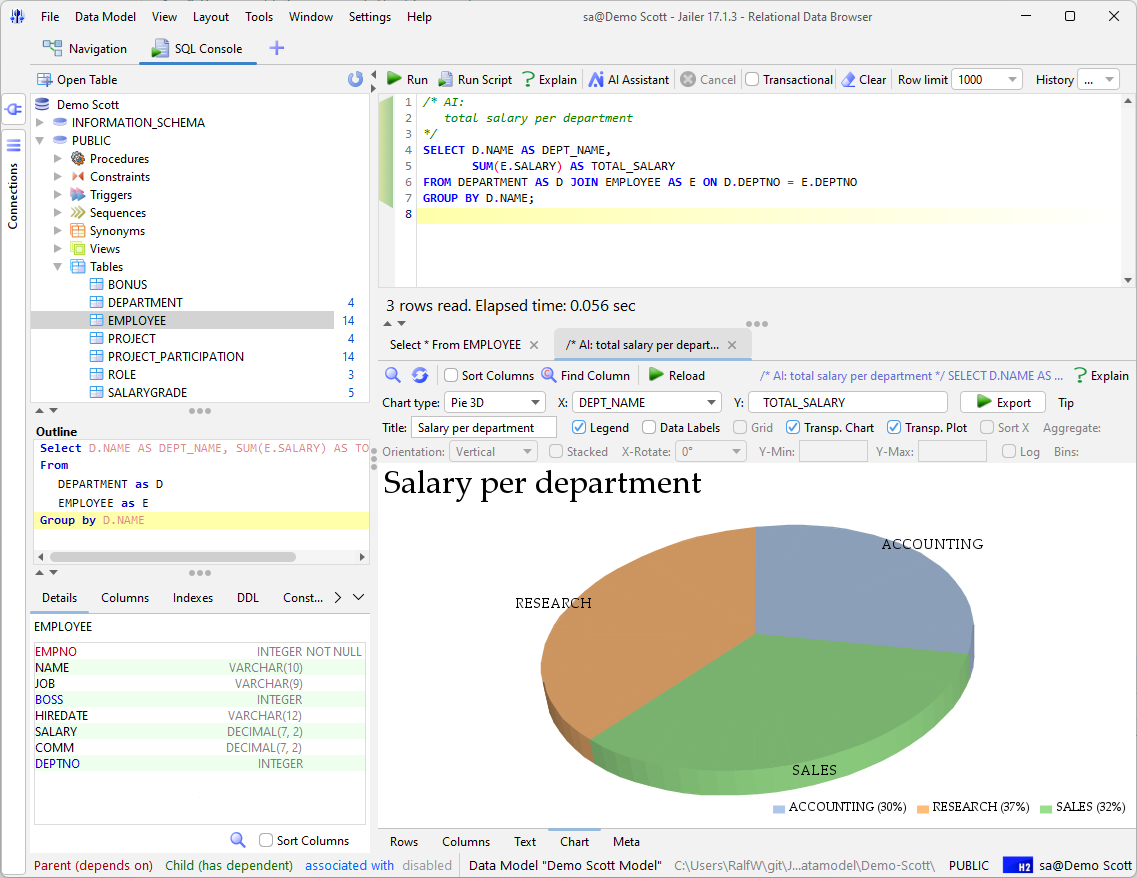
After executing a query, switch to the Chart tab to visualize the result set.
Choose from 11 chart types including bar, line, pie, area, scatter,
and their 2D and 3D variants.
Charts are highly customizable:
- Color schemes and transparency
- Aggregation functions (sum, average, count, …)
- Axis scaling and labeling
- Data labels on or off
Finished charts can be exported as PNG, JPEG, or SVG.
Video
Exporting data using the Data Browser
|